Add true user local time layer to Google Analytics data
If you manage data for online properties with global audiences you might have noticed Google Analytics reports on Account Level time (i.e. hour of day) and not User level time. This can pose an issue for some.
So, what’s the problem?
Google Analytics reports date and time of a hit at the account timezone level. This cancels out some of the in-day trends you might expect to find. Let’s examine an example from traffic coming into a global recipe website from the last day of 2018.
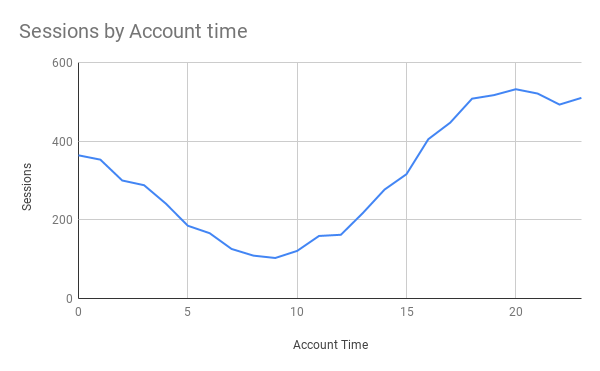
The general shape of the chart makes sense but there are great issues with it.
- It is easy to see that the time axes is obviously in an offset. The dip in traffic is expected to be strongest in the dead of night and not late morning.
- Somewhat harder to see, but the difference in traffic between peak and bottom hours is not strong enough (~5.2X).
How does a good case look like?
After applying time adjustments based on user locations, the result now looks very different.
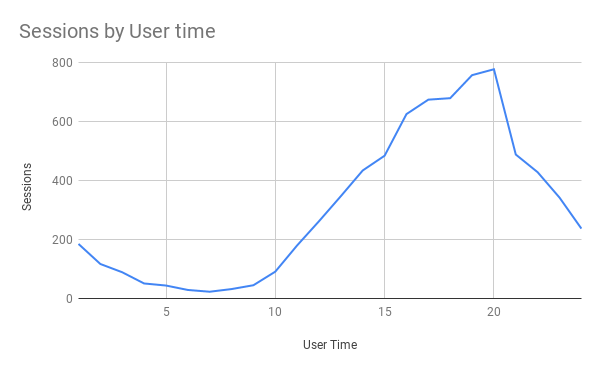
- The time axes is now aligned with expectations. Traffic starts peaking ~10:00 am and trend breaks down sharply at 20:00. This makes a lot of sense given this is a food recipes website.
- The traffic ratio between peak and bottom is now (~33.8X). I’m glad to see most folks are getting heir well needed sleep.
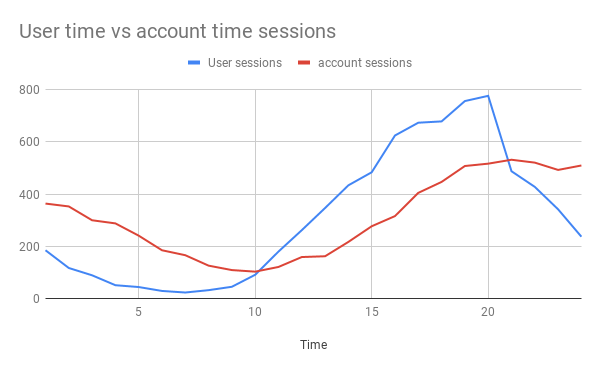
Have a look at these charts compared:
Solution
A good solution would be to implement a custom dimension in Google Analytics that stores the users local time and/or timezone. This can be easily done with Google Tag Manager as gracefully explained in Simo Ahava’s Blog.
Some uses however might find this option a bit more complicated and time consuming to implement. In addition this solution will only apply for new sessions coming in and does not apply to your older data. What if you just want to quickly report on your historic data?
A simpler solution
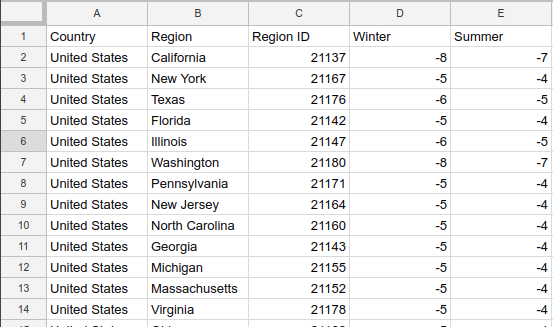
I have created a mapping table showing you the correct timezone per Country, Region and Region id so you can easily adjust the time on your exported report.
Try it yourself
I have made it very simple for you to try this solution on your own data. It should take less than 5 minutes to follow these steps:
- Import the custom Google Analytics report I have created, and use it to export your data into a CSV or Google Sheet.
- Open the Google sheet template I created for you, and create a copy of it to allow edits.
- Copy the data you exported from your account into the ‘Raw data’ sheet in the copy you made of the template.
- If required, expand the equation column ‘F’ in the ‘Raw data’ sheet to cover all rows.
Congratulations, you now know the true user time trends of your online property!
Part II – Nerdy complications
(the fun stuff)
After covering the basic issue and showing the solutions, it is time to talk time measurements complications resulting from timezone adjustments.
Complication 1: Daylight saving time not globally widespread
Not all countries utilize daylight saving time. Most of Europe and North America does, with a few exceptions e.g. Iceland & Turkey.

Solution – I added two separate columns for ‘Summer’ / ‘Winter’ (in the northern hemisphere). If the data you are handling only falls into one of these seasons (e.g. Dec 20th – Dec 27th), simply grab the relevant column.
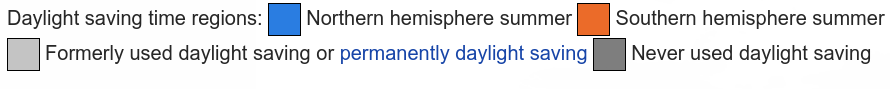
Complication 2: In some countries only some regions utilize daylight saving
This fact is pretty annoying, yet true. To give a few examples: DST is used in the USA except for the states of Hawaii and Arizona where, well, it is simply not used.
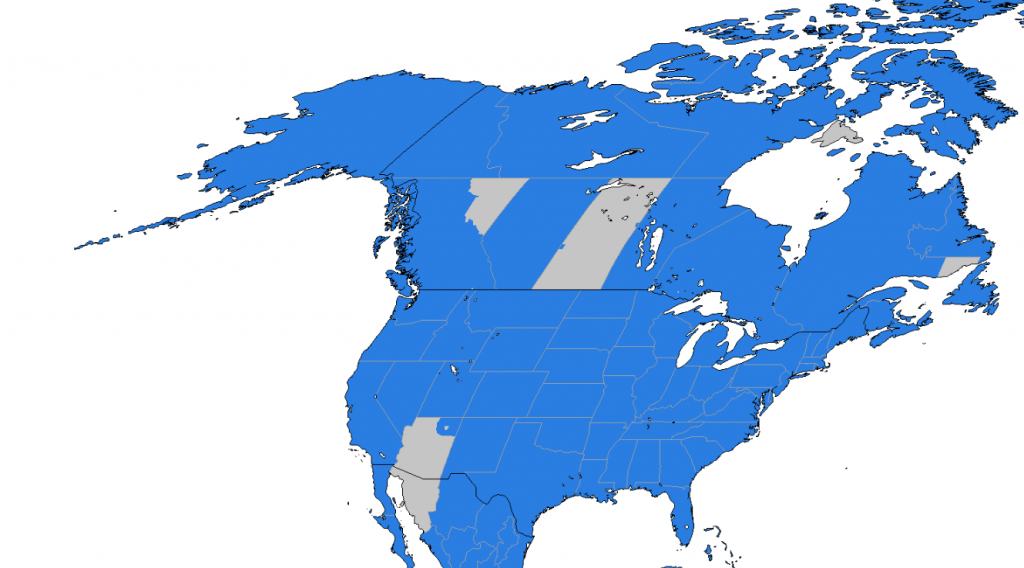
TimeZonesBoy [CC BY-SA 3.0 (https://creativecommons.org/licenses/by-sa/3.0)], from Wikimedia Commons
Solution – Pretty simple. The data is provided by country and by region. If your data involves countries with split DST use, make sure you use the region level data.
Complication 3: Different DST start & end date by country
As if things aren’t complicated enough as it as, apparently different countries don’t see eye to eye on the topic of what should be the first and last day of DST. For example, in the USA DST starts on the second Sunday of March, while in Norway it’s on the last Sunday of March. Fortunately enough I hadn’t come across case where different things if the same country disagree on this issue.
Solution – I added a column stating the first (min) and last (Max) week number where DST was observed by region. Now so that is left is to export date from Google analytics by week and join the correct user time based on region and week of the year.
Part III – Your part
Making this article available took a lot of work. If you enjoyed it, pleease consider one or more of the following:
- Share it in your favorite social platform
- Check the data set for your location and let us know if anything is out of order. You can add your data directly to the github project.
- Add your thoughts in the comments below